Summary report 2015
Report Created: 2021-02-09 22:05:57
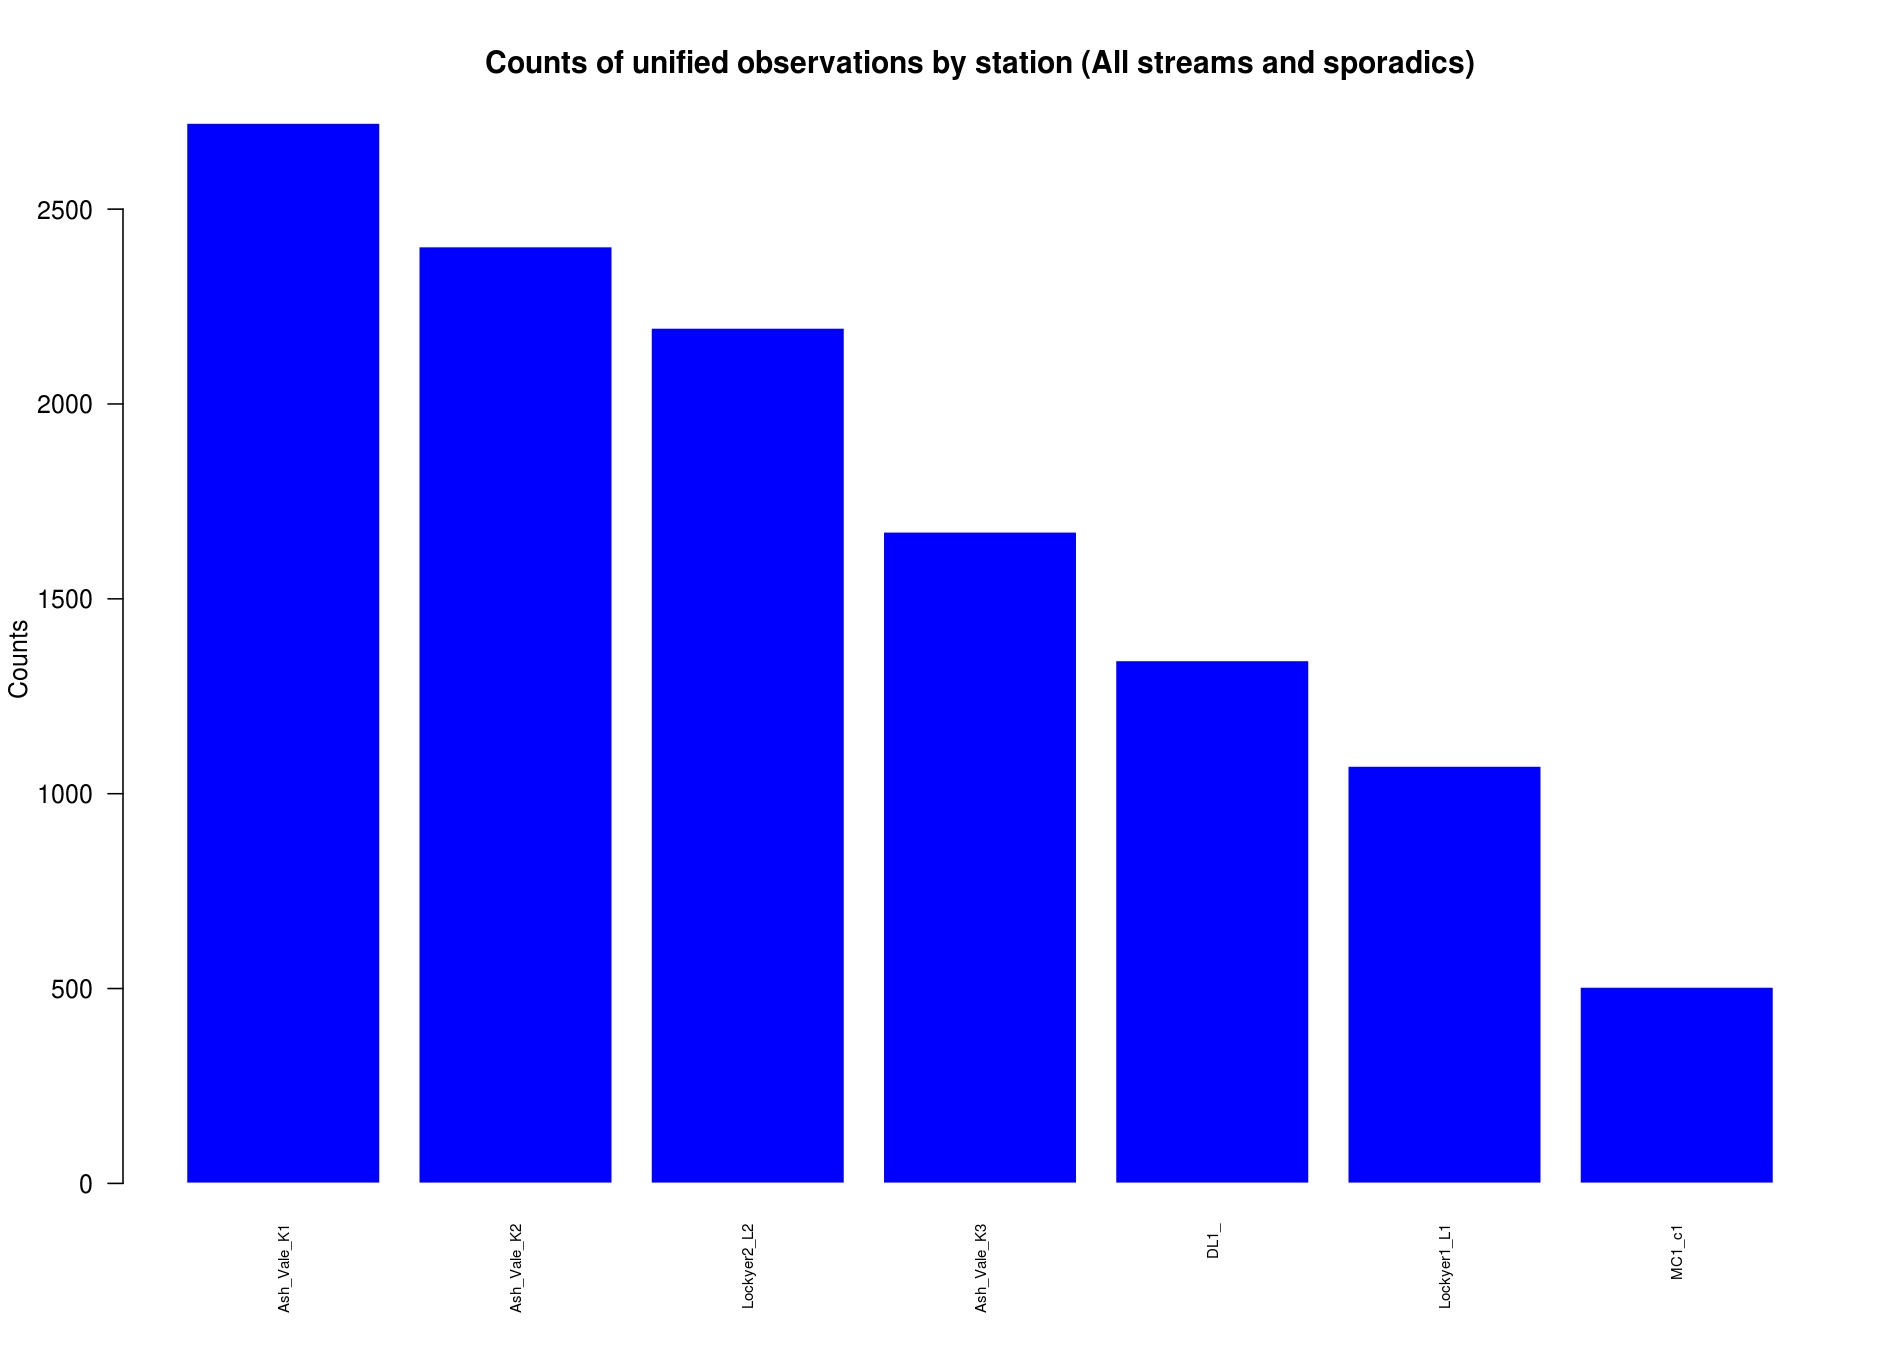
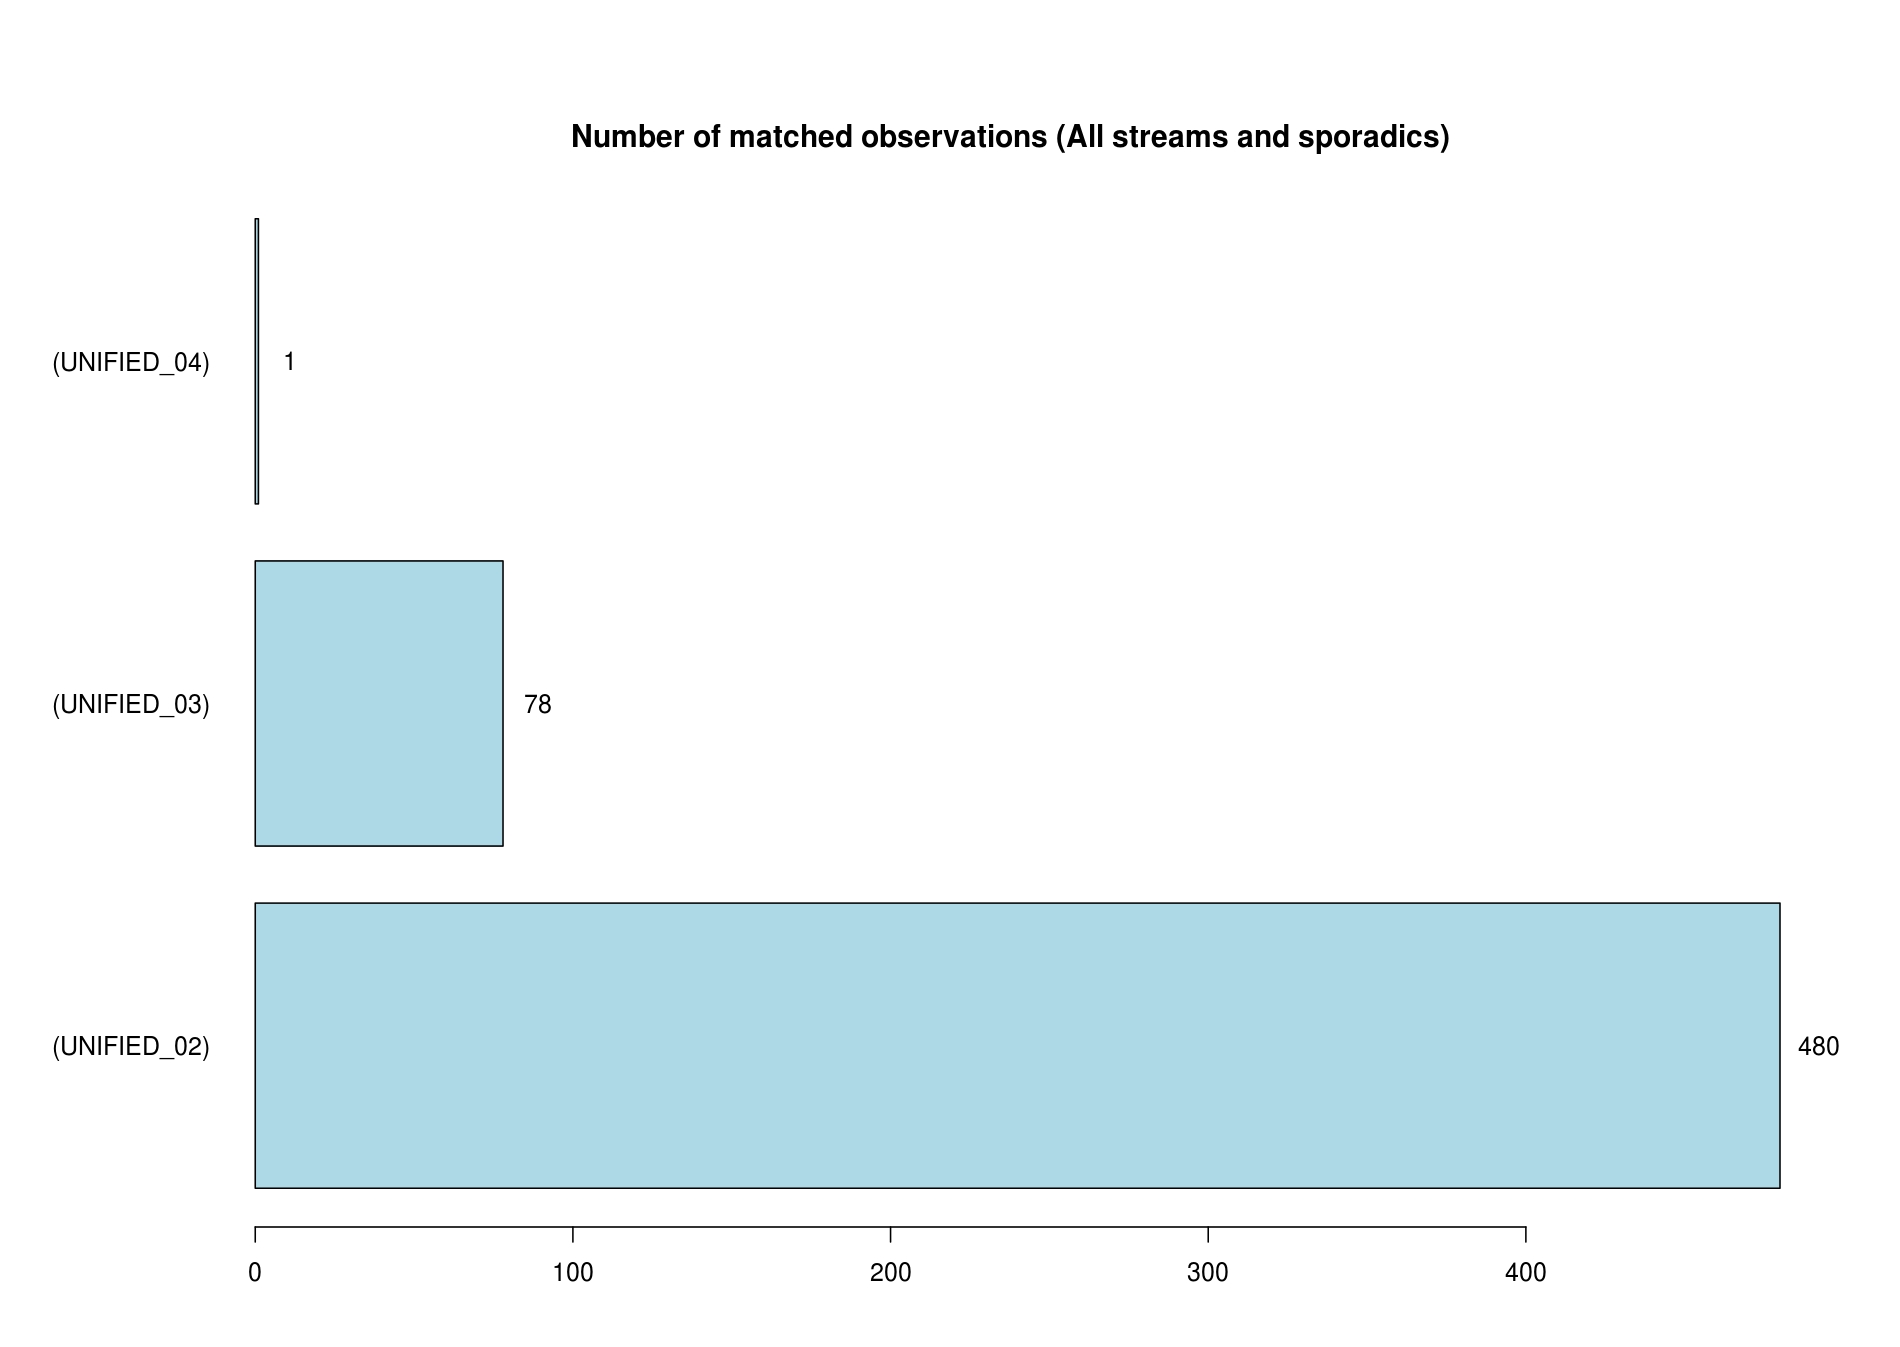
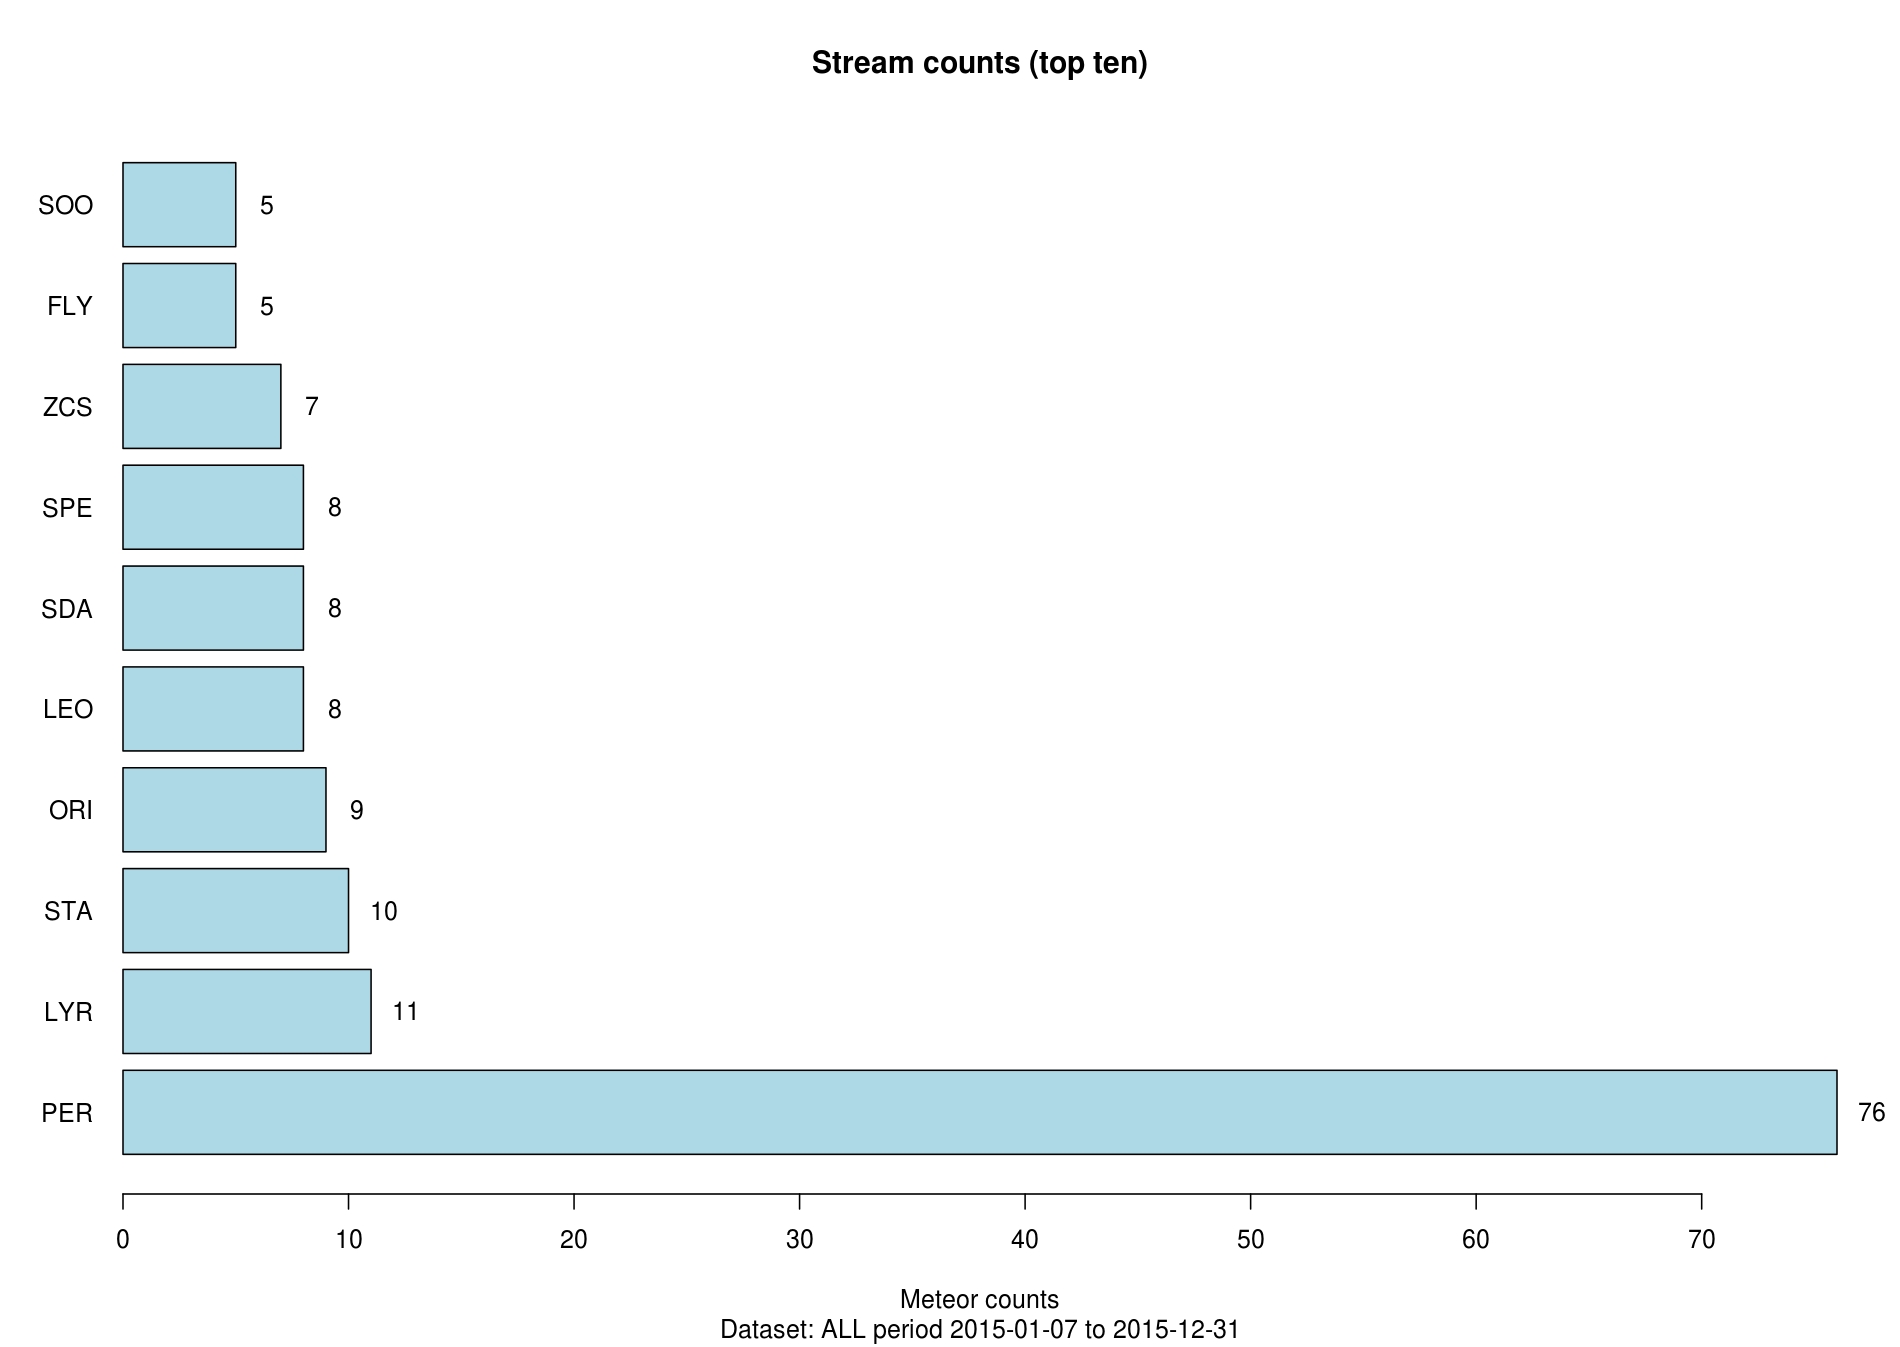
A total of 8 cameras recorded 11909 individual meteor observations and 559 meteors were observed by more than one camera (Unified observations). A breakdown of unified observation counts by stream (top ten) is and where possible these were further analysed to determine the orbit and other details of the meteoroid. The number of unified observations as a percentage of individual observations is 4.6%. Click on the charts to see a larger version:
Fireball Activity and Magnitudes
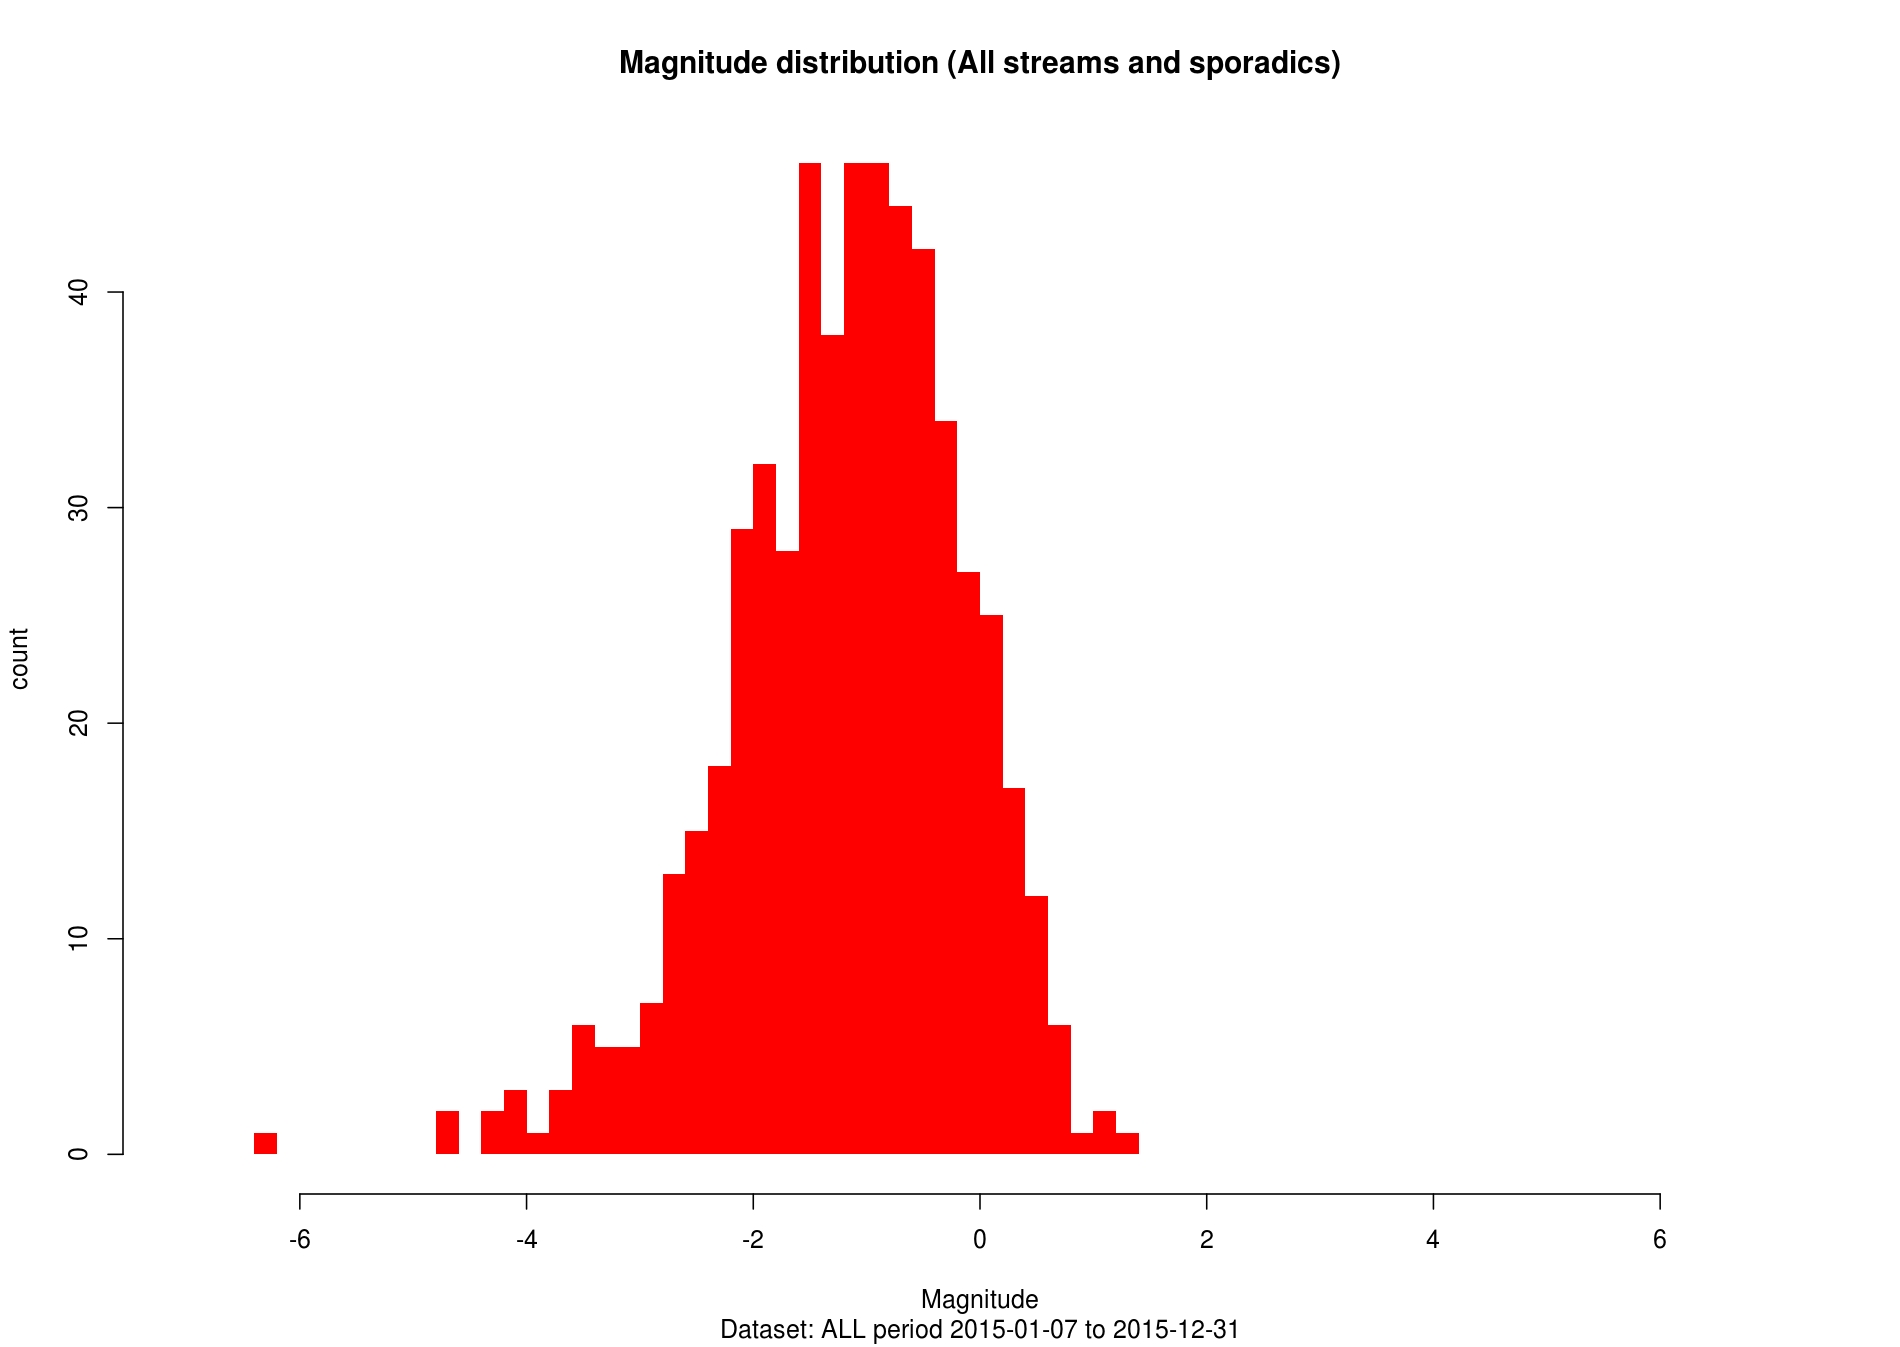
A total of 0 fireballs were observed in the reporting period. A fireball is defined as a meteor event with an absolute magnitude of -4 or less. A breakdown by month and by shower is shown below.
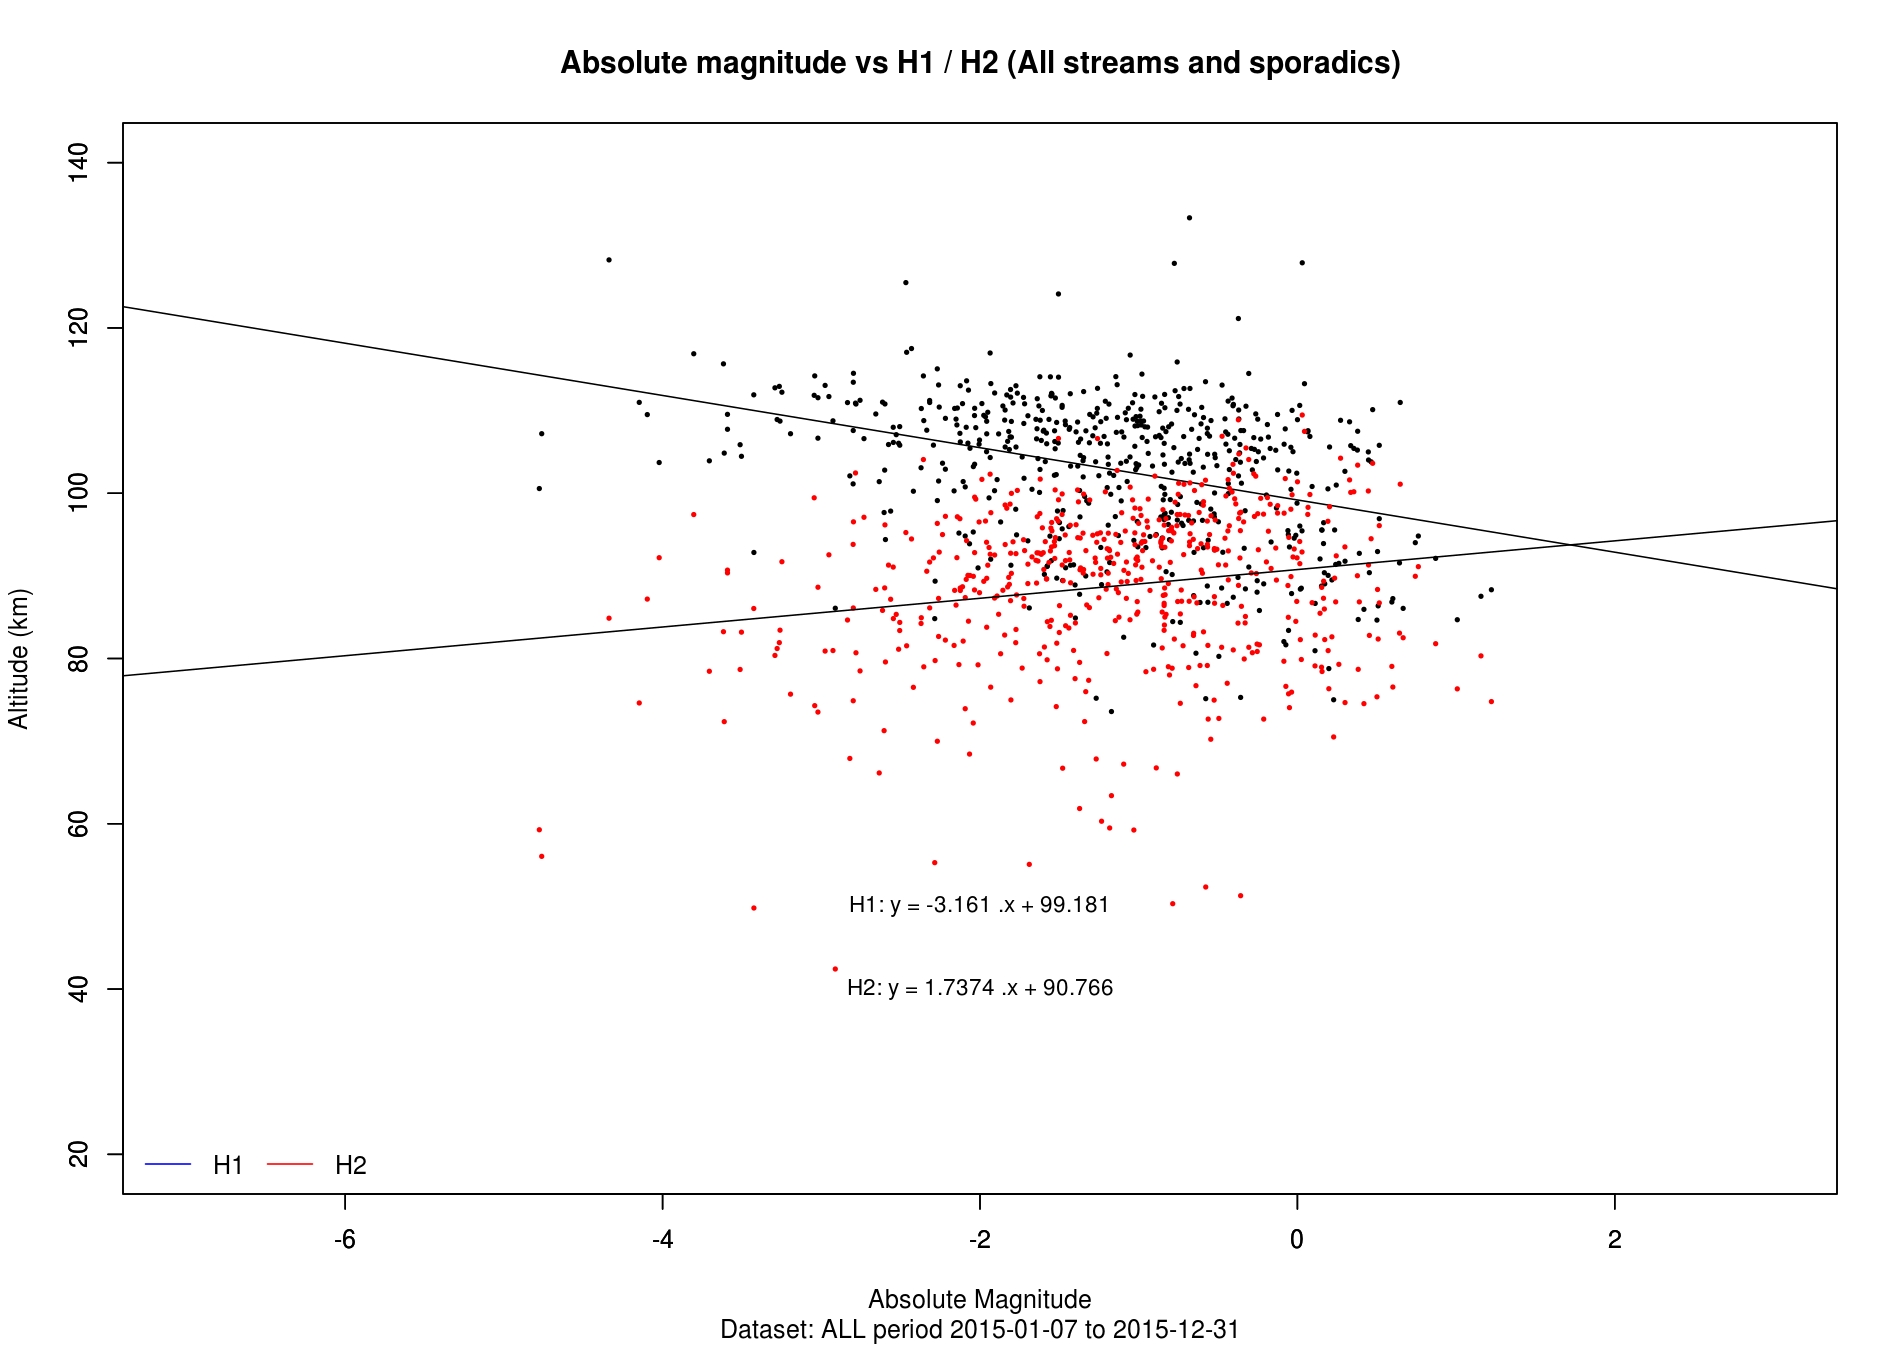
The absolute magnitude distribution and the variation of magnitude with start and end altitide are useful to look at as well. There is usually a correlation between magnitude and start/end altitude, as small faint meteors will tend to become visible lower and burn up at a higher altitude, whereas conversely large meteors will become visible sooner and may last longer. A straight line fit through the two sets of data will thus often show a convergence towards the right of the graph.
Velocity Distribution
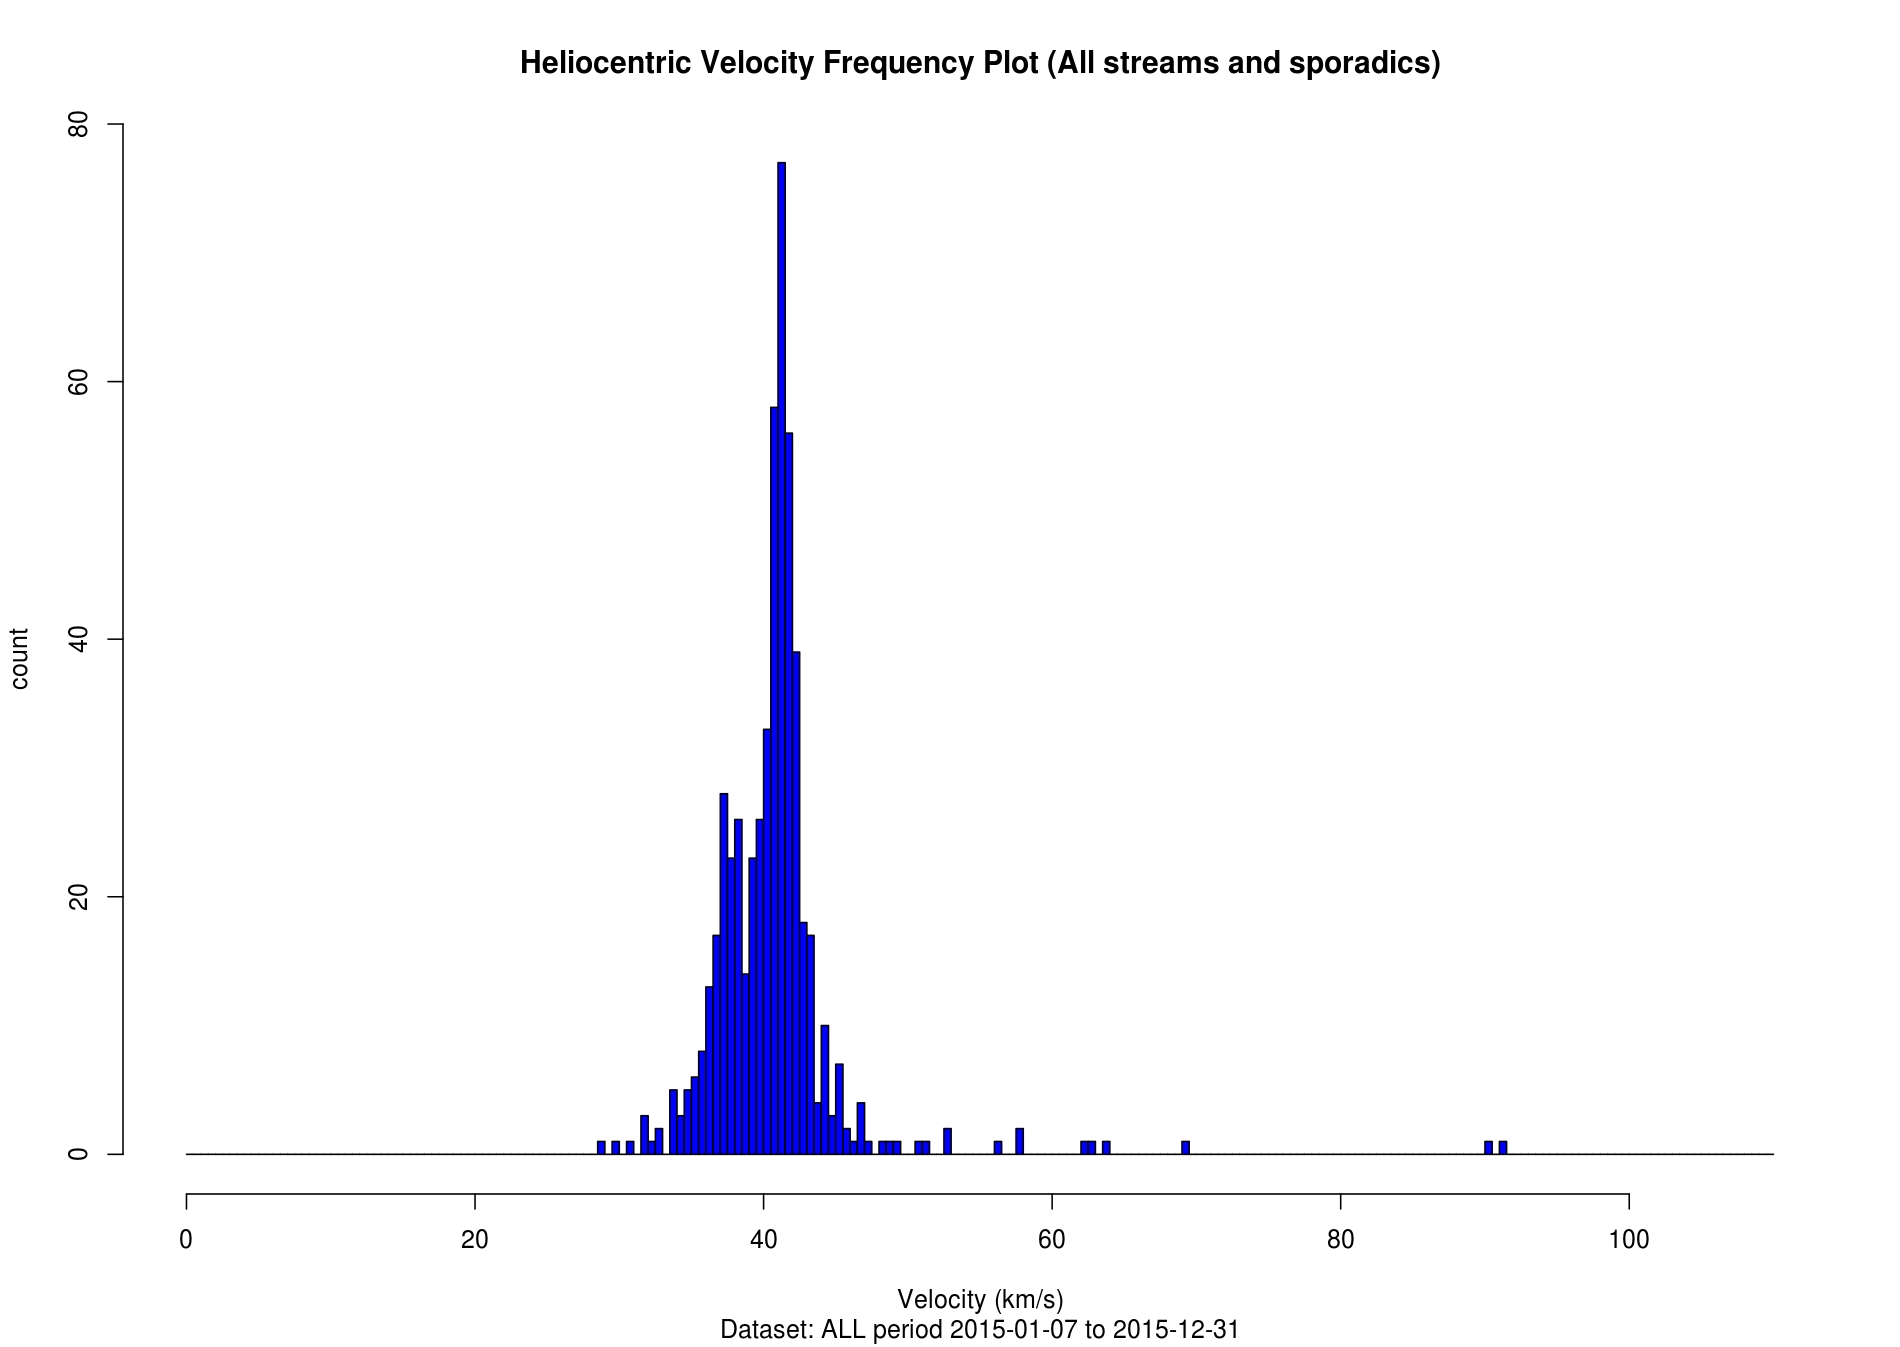
The following graphs show the distribution of observed and heliocentric velocity in the in the unified data. Observed velocity is the velocity as measured from the observer's location. Heliocentric velocity is the true velocity of the meteoroid around the Sun. There can be an appreciable difference between these values due to the velocity of the Earth along its orbit and of the observer they rotate with the Earth.

Altitude and Distance
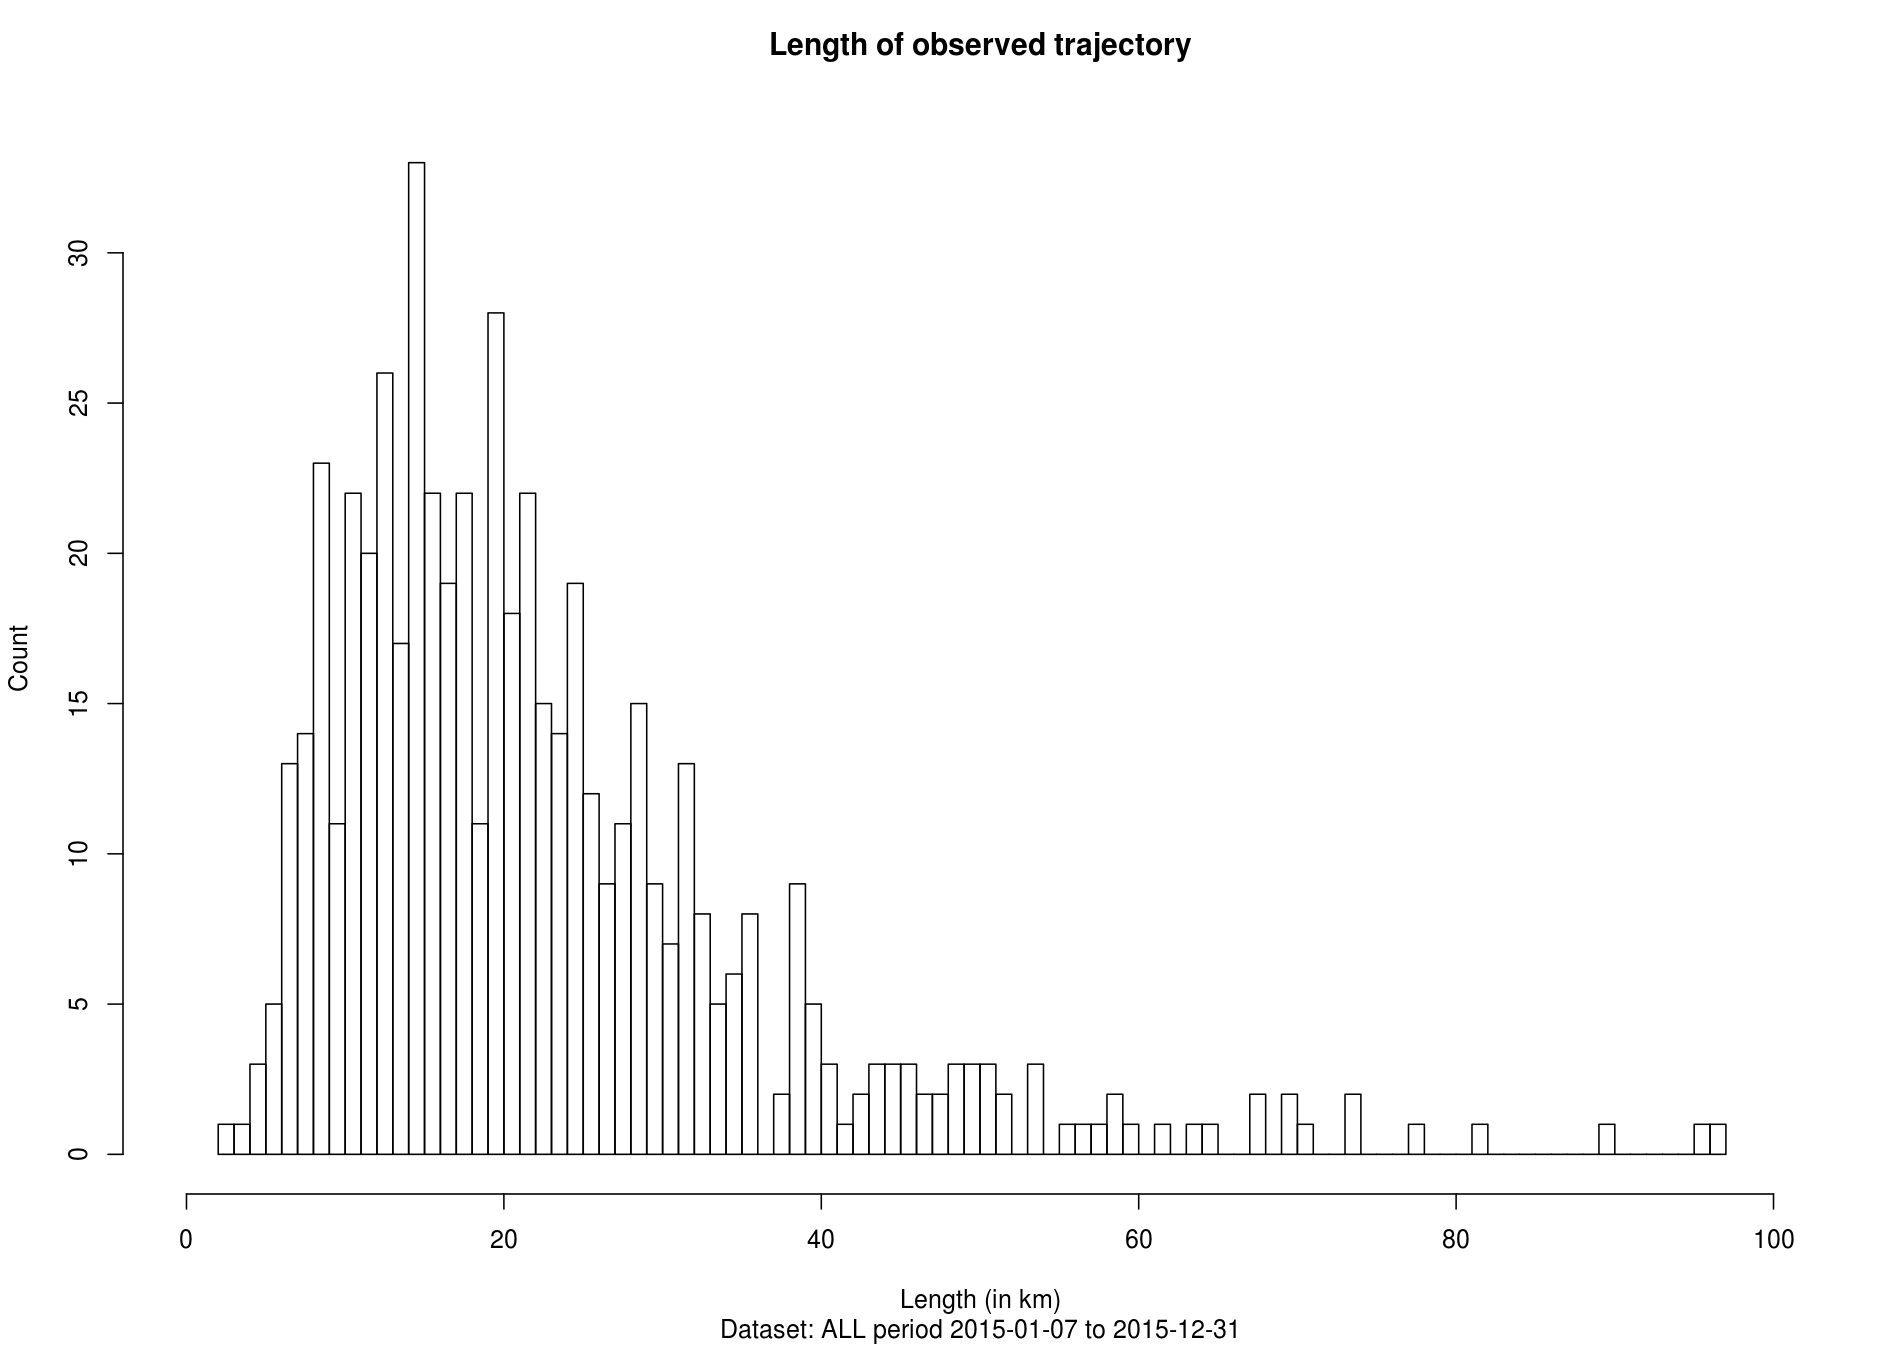
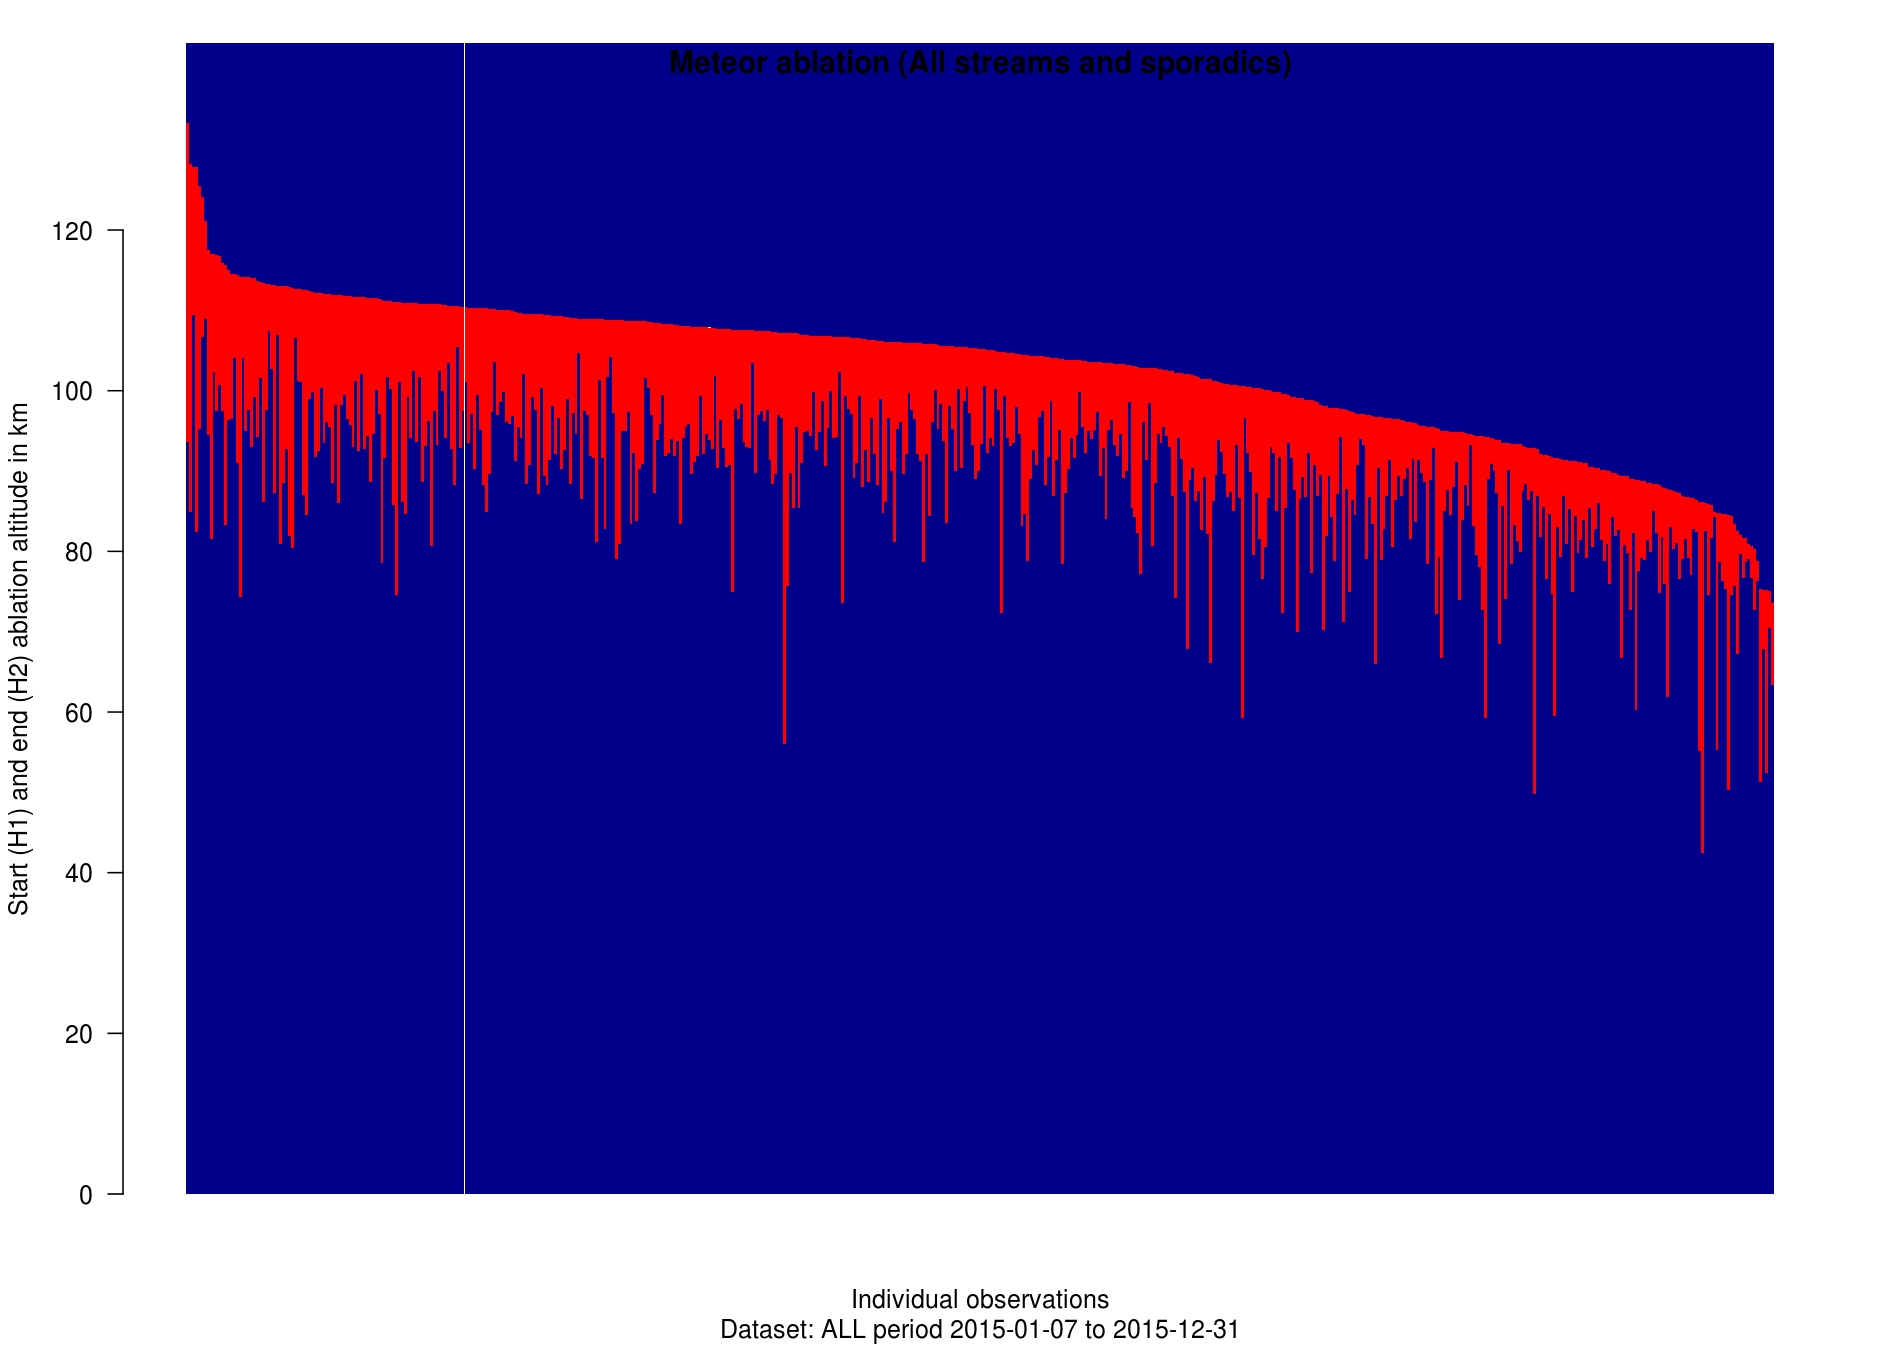
The following graphs shows the distribution of ground distance travelled and the altitude of the start and end of ablation for each individual meteor. Ground distance is the linear distance from the first to the last observed point. The ablation plot gives a visualisation of the vertical distance over which the meteor ablated or burned up. The height at which this occurs will depend on factors such as meteor size, velocity and composition. The maximum observed altitude was 68845.9 km and the minimum observed altitude was 42.4 km.
Orbital Analysis
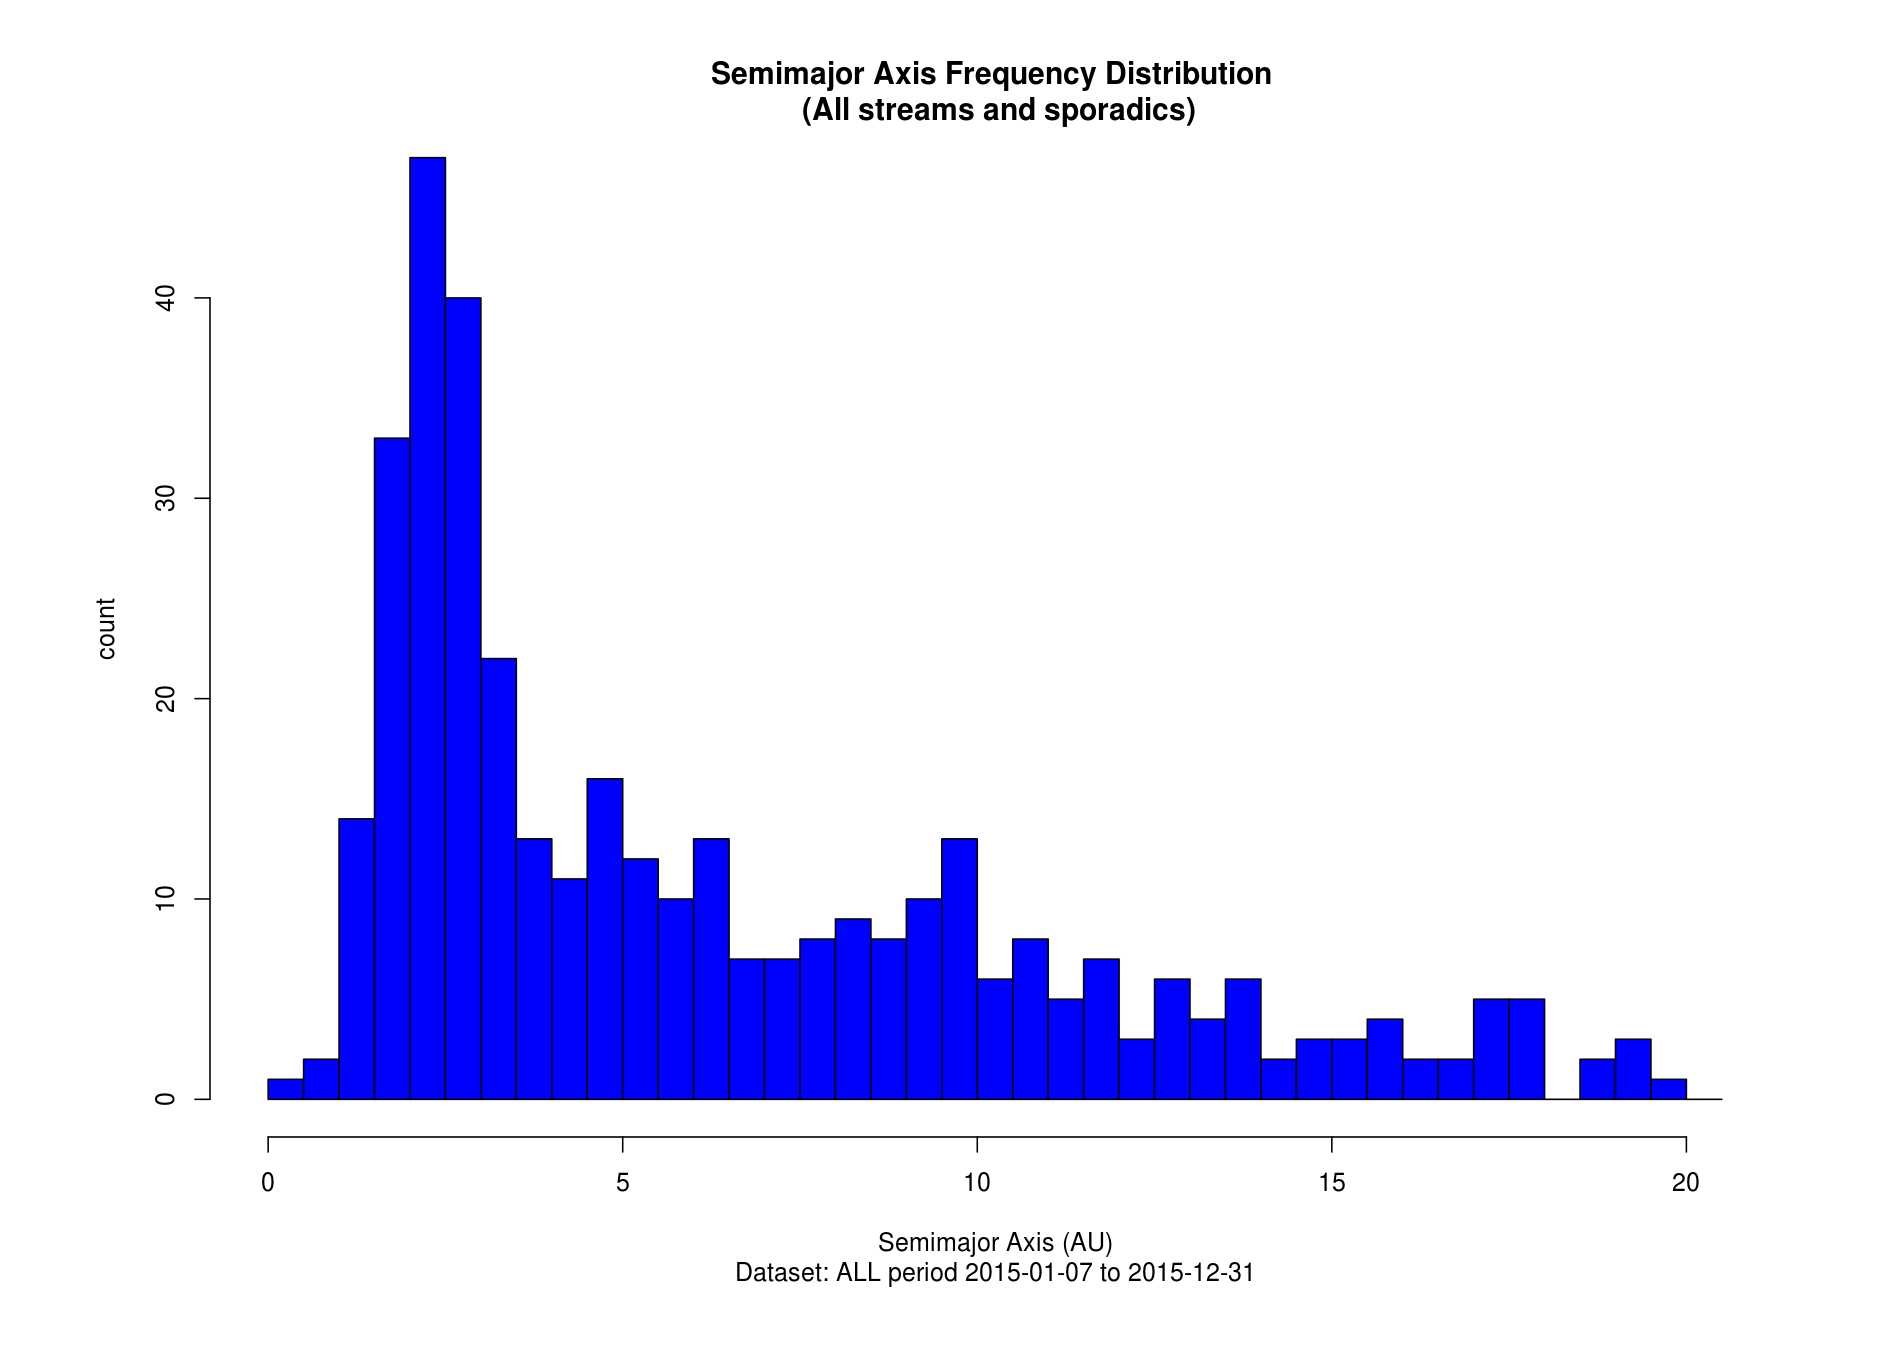
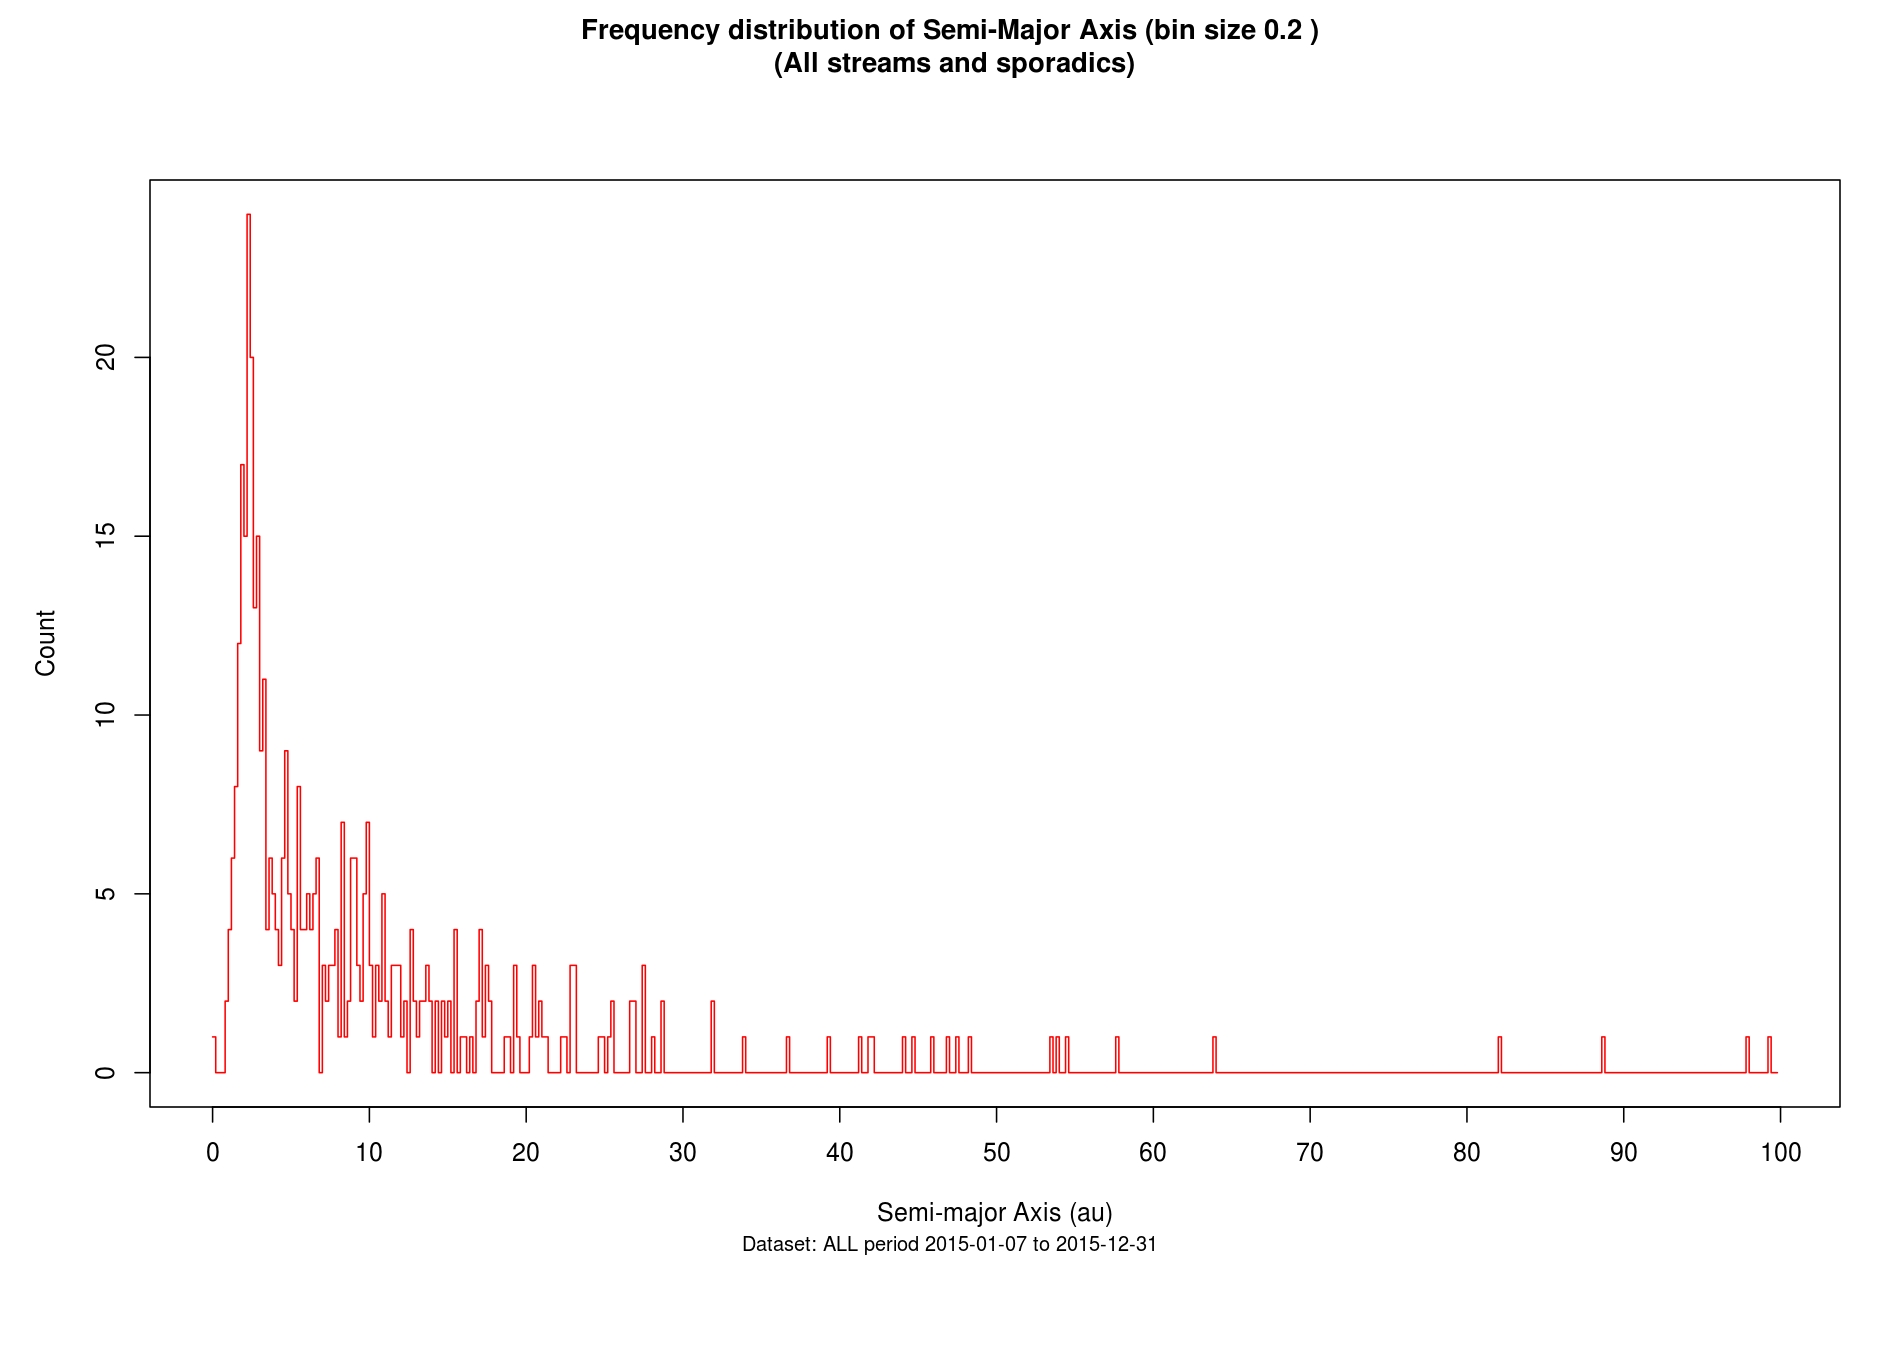
Analysis of the trajectory and orbit was performed for unified events. The charts below show the distribution
of semimajor axis amongst the unified events. Some showers show pronounced clustering of semimajor axis
due to gravitational resonances, particularly with Jupiter. Extremely large values are also possible
and often indicate that the meteoroid has been severely perturbed by close passage near a planet.
Also shown is the position of the apparent radiant of each unified event. These should (obviously)
cluster round the radiant of the shower but its normal for shower meteors to be a few degrees
away from this, though its important to remember that for most showers, the radiant moves
location each night due to the Earths movement through the debris stream.
The matching process uses distance from the expected radiant to filter
candidate events.
